Data Preparation
The dataset was cleaned, missing values handled, and numerical features scaled using standardization to ensure effective distance calculations in clustering. Key steps included:
- Collection of country-level data from World Bank and UN datasets
- Handling missing values through mean imputation for countries with partial data
- Feature engineering to create composite indicators
- Standardization using StandardScaler to normalize features to comparable scales
Dimensionality Reduction
PCA was used to reduce the dataset to two principal components for visualization while retaining maximum variance from the original features.
- Applied PCA to reduce 15 features to 2 principal components
- These components captured 73% of the variance in the original dataset
- Feature importance analysis revealed GDP per capita and life expectancy as the most influential variables
The dimensionality reduction simplified the data while preserving meaningful relationships between countries.
Clustering with K-Means
K-Means clustering was applied to the transformed data. The optimal number of clusters was determined using the Elbow Method and Silhouette Score.
- Tested K values from 2 to 10 clusters
- Elbow method indicated K=4 as optimal
- Silhouette score of 0.68 confirmed good cluster separation
- Final model implementation with K=4 clusters
Cluster Visualization
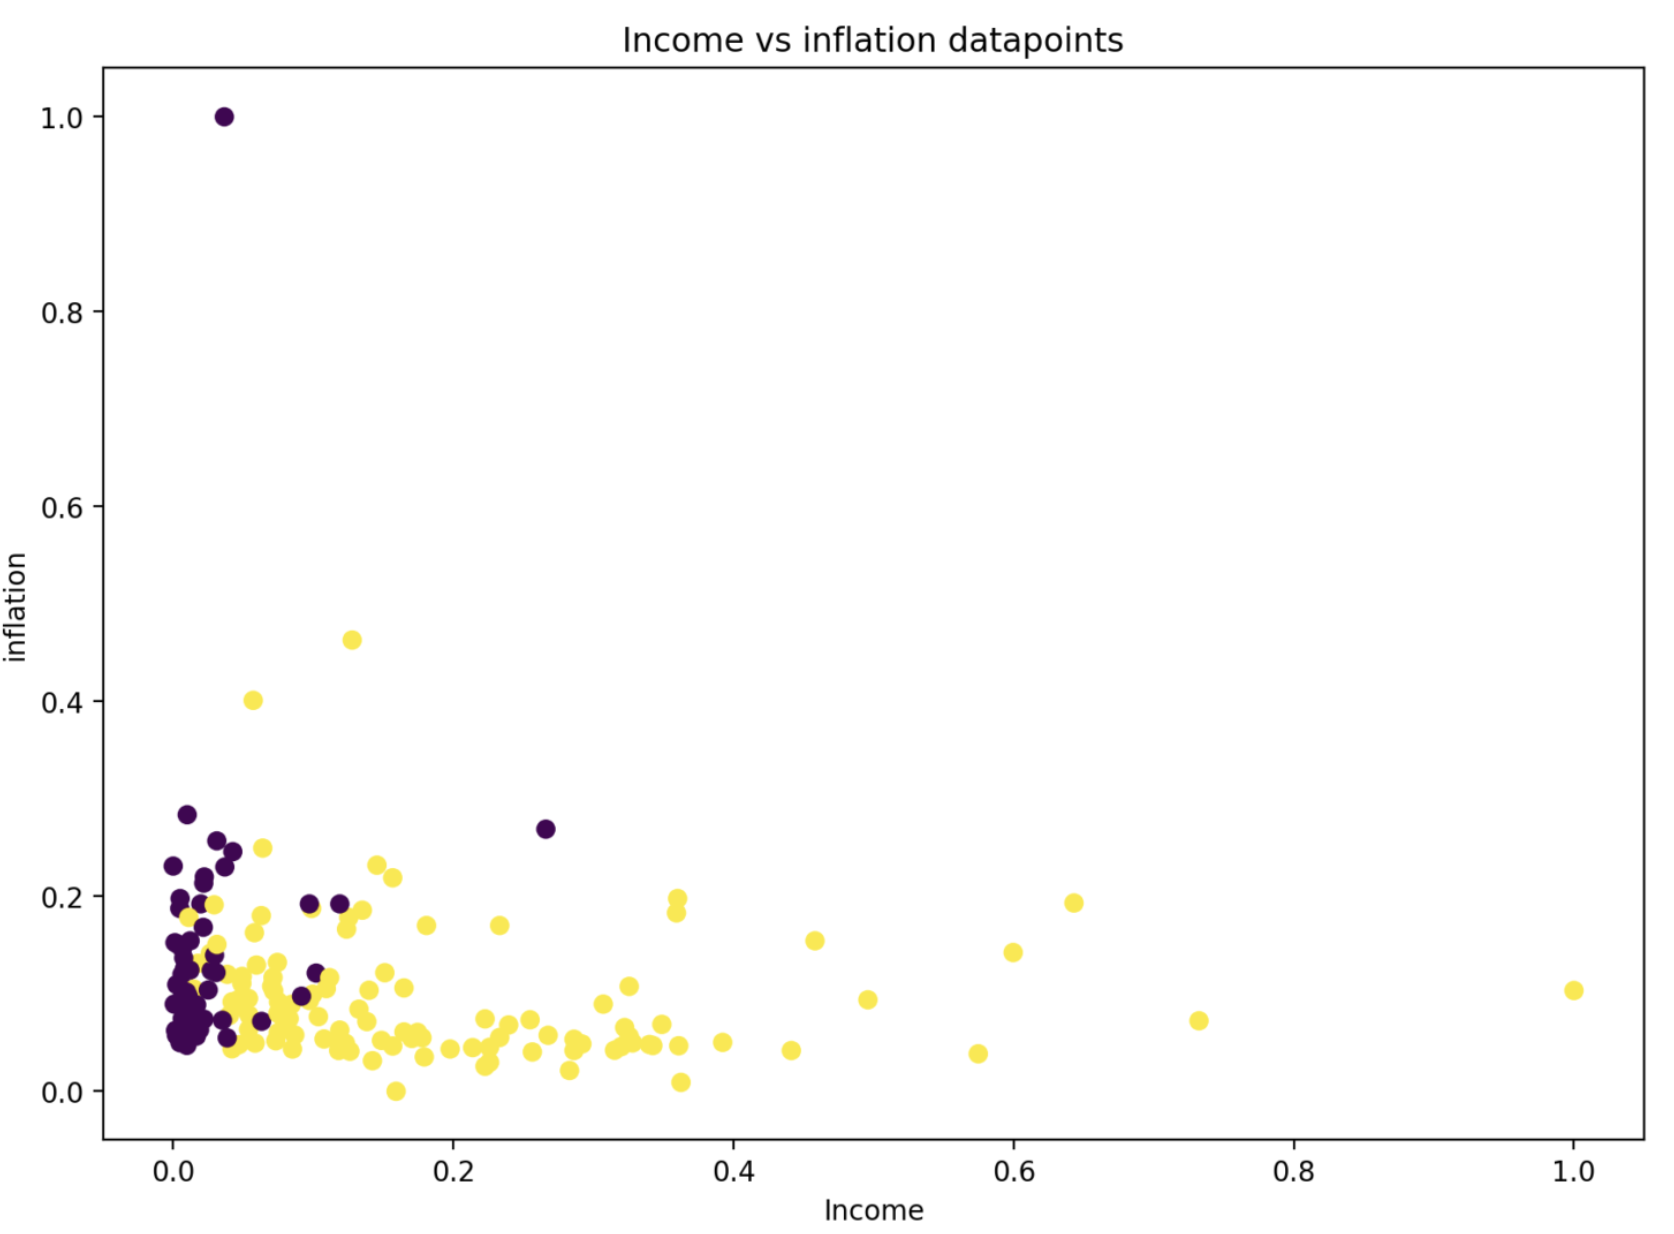
The final clusters were visualized in a 2D PCA plot, colored by cluster label. The interactive visualization allows users to explore how countries are grouped based on similar traits.
- Created an interactive scatter plot with Plotly
- Implemented geographic mapping to visualize global patterns
- Developed parallel coordinates plot to show feature distribution across clusters
- Built an interactive Streamlit dashboard for exploration