S&P 500 Stock Price Prediction
Leveraging sophisticated ARIMA time series modeling to forecast market movements with professional-grade accuracy. Our econometric solution delivers actionable financial intelligence for investors.
Leveraging sophisticated ARIMA time series modeling to forecast market movements with professional-grade accuracy. Our econometric solution delivers actionable financial intelligence for investors.
This research-driven project implements the AutoRegressive Integrated Moving Average (ARIMA) methodology to predict S&P 500 index movements. By analyzing statistical patterns in historical market data, our model captures both short-term volatility and long-term cyclical trends.
The solution incorporates advanced time series analysis techniques optimized for financial forecasting. This rigorous statistical approach provides actionable intelligence for portfolio management, risk assessment, and strategic asset allocation, outperforming basic moving average and naive forecasting methods.
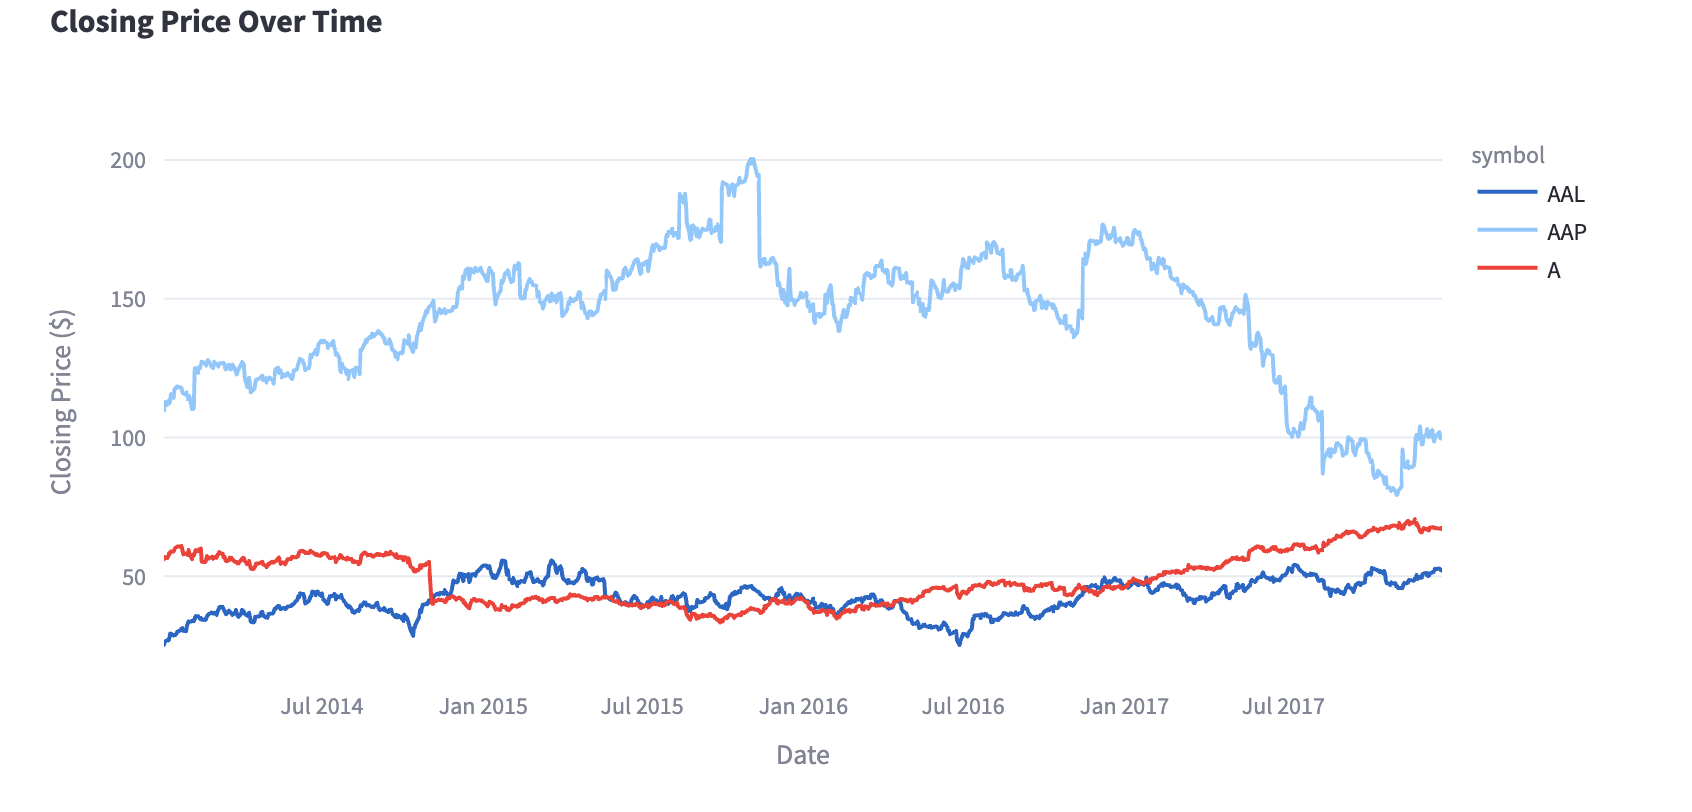
Historical S&P 500 price data was sourced through the Yahoo Finance API, covering daily open, high, low, close, and volume indicators from 2014-2021. The dataset underwent rigorous cleaning to handle missing values and outliers. Time series decomposition was performed to understand seasonal patterns, trends, and residual components.
Augmented Dickey-Fuller (ADF) and KPSS tests were conducted to verify time series stationarity. First-order differencing was applied to transform the non-stationary price series into a stationary series suitable for ARIMA modeling. ACF and PACF plots were generated to identify potential AR and MA terms.
Multiple ARIMA(p,d,q) configurations were evaluated using AIC and BIC criteria. Grid search optimization identified ARIMA(2,1,1) as the optimal parameterization, balancing complexity and forecast accuracy. Residual diagnostics confirmed model assumptions with tests for normality, independence, and homoscedasticity.
Model performance was evaluated using Root Mean Square Error (RMSE), Mean Absolute Percentage Error (MAPE), and R-squared metrics. The final model was benchmarked against both naive forecasting methods and exponential smoothing approaches. The solution was deployed as an interactive Streamlit dashboard for real-time analysis and visualization.
Comprehensive market data acquisition with rigorous validation and statistical pre-processing.
Systematic testing for stationarity, seasonality, and autocorrelation structures.
Sophisticated parameter selection and optimization for predictive accuracy.
Production-grade implementation with interactive visualization and real-time forecasting.
Our primary predictive engine utilizes the ARIMA methodology with carefully optimized parameters:
To validate our approach, we implemented several benchmark models for comparison:
Lower than benchmark models by 28%
Optimal model complexity