🏥 Healthcare Insights Dashboard
A comprehensive analytics solution designed to transform healthcare data into actionable insights, helping medical institutions make data-driven decisions.
Project Overview
The Healthcare Insights Dashboard is an interactive web application built with Streamlit and Python that transforms raw healthcare data into meaningful visualizations and actionable insights. It combines descriptive analytics with predictive capabilities to help healthcare administrators, clinicians, and analysts make informed decisions.
The dashboard provides a comprehensive view of patient demographics, medical conditions, billing trends, admission patterns, and more. It features interactive filters, downloadable reports, and even a machine learning model to predict patient test results based on various factors.
Key Features
- Interactive Data Exploration: Filter data by medical condition, gender, and more
- Critical KPI Metrics: At-a-glance view of patient count, average billing amounts, and stay duration
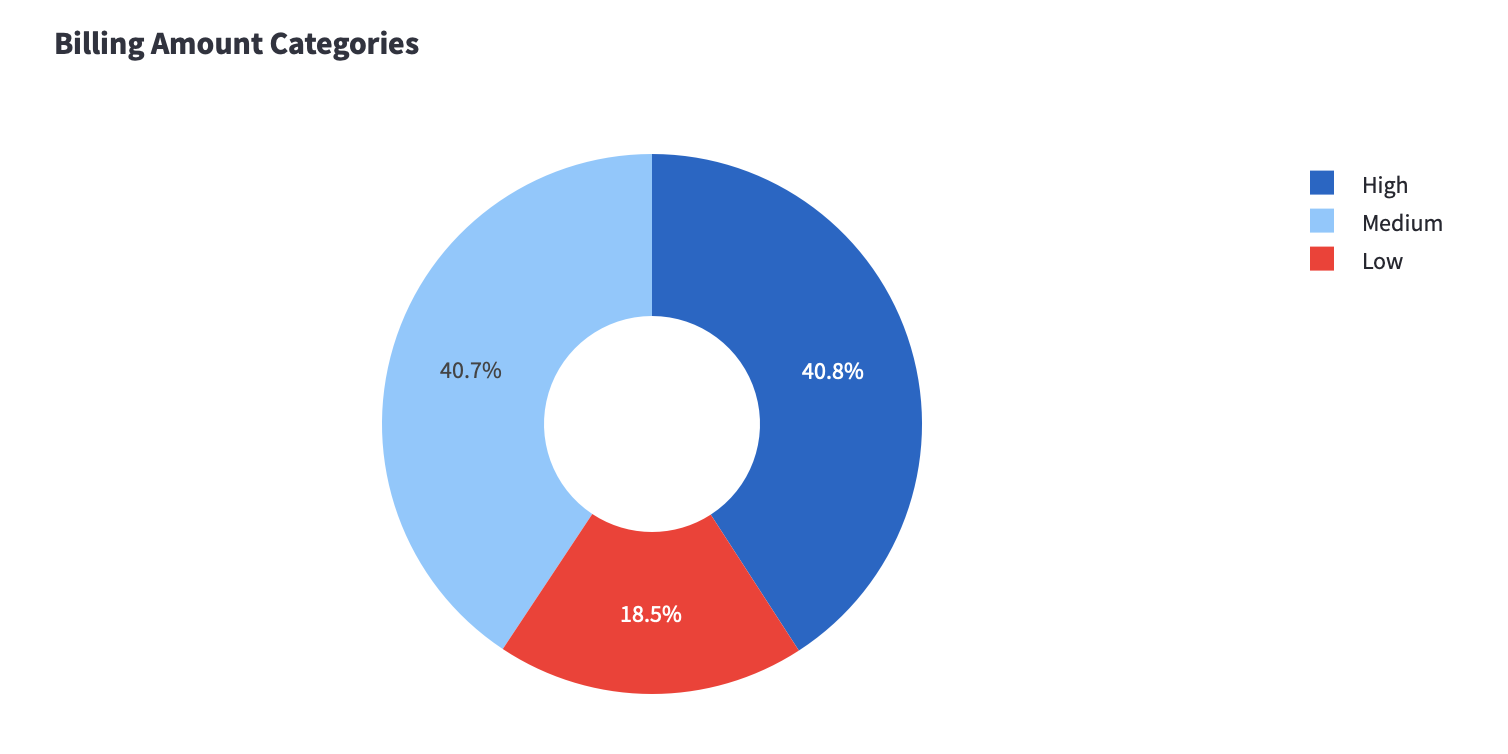
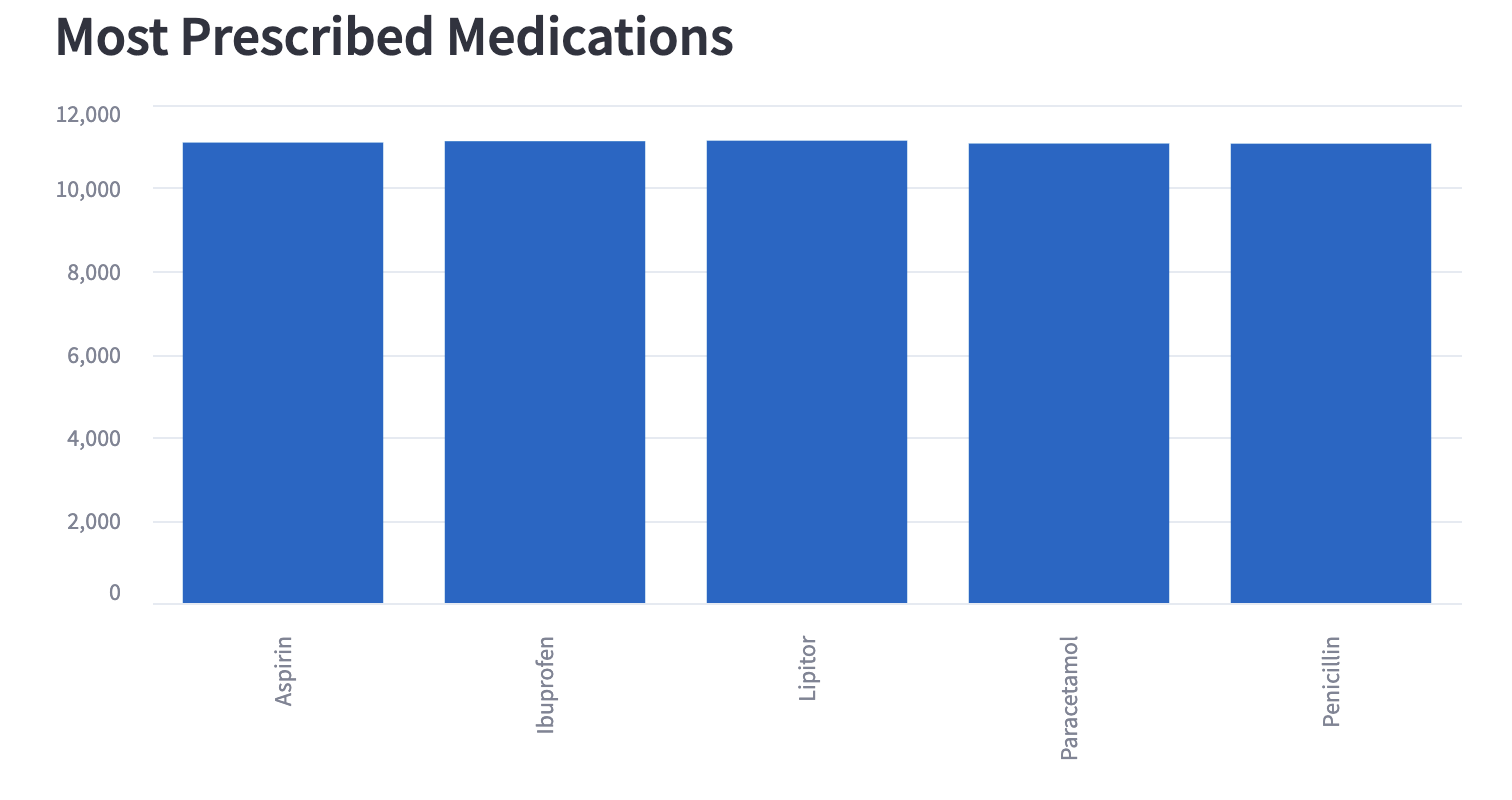
- Comprehensive Visualizations: Charts and graphs for patient demographics, billing categories, and medical conditions
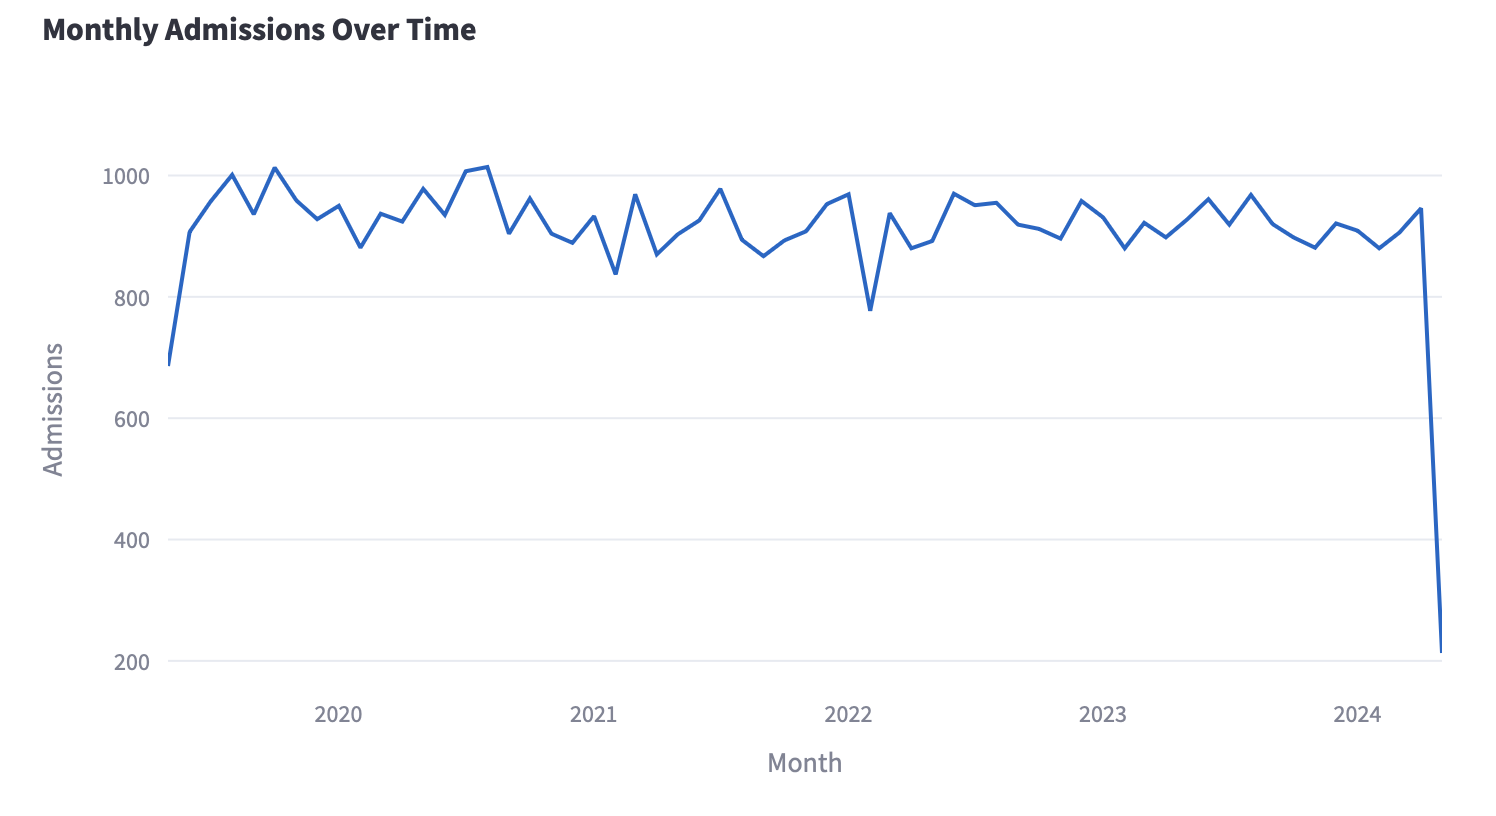
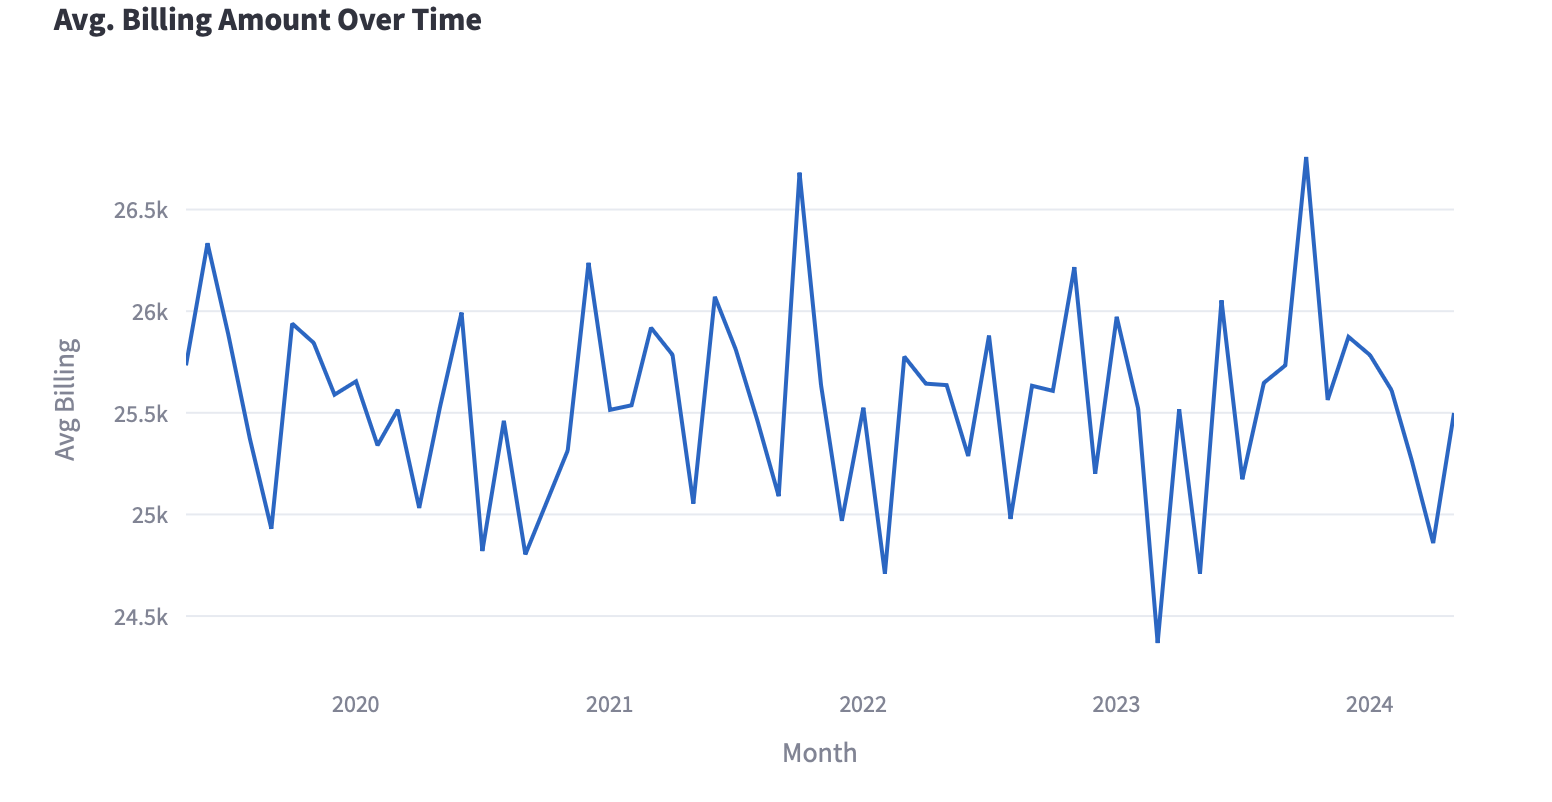
- Time Series Analysis: Track admissions, discharges, and billing trends over time
- Data Quality Alerts: Automatic detection of anomalies like negative billing amounts
- ML-Based Predictions: RandomForest model to predict test results for new patients
- Export Functionality: Download filtered data for further analysis
Technical Implementation
This project is built with the following technologies:
The application features optimized data processing with caching for improved performance, interactive data filters that update visualizations in real-time, and a machine learning pipeline using RandomForestClassifier to predict patient test results.
Analytics Capabilities
The dashboard provides multiple analytical perspectives:
- Patient Demographics: Gender distribution and age analysis
- Clinical Analysis: Medical conditions, test results, medications
- Financial Insights: Billing categories, insurance providers, average billing by condition
- Operational Metrics: Admission types, stay duration, monthly trends
- Predictive Models: Test result prediction based on patient attributes
Each visualization is designed to answer specific healthcare management questions and support strategic decision-making.
Dashboard Screenshots
Ready to Explore the Dashboard?
Experience the power of interactive healthcare analytics with our comprehensive dashboard. Try it live or check out the source code to see how it's built.
View Live Demo View Source Code Back to Projects